
Teranet-National Bank House Price Index growth moderates in September

 October 20, 2023
Teranet-National Bank House Price Index growth moderates in September
MONTH-OVER-MONTH
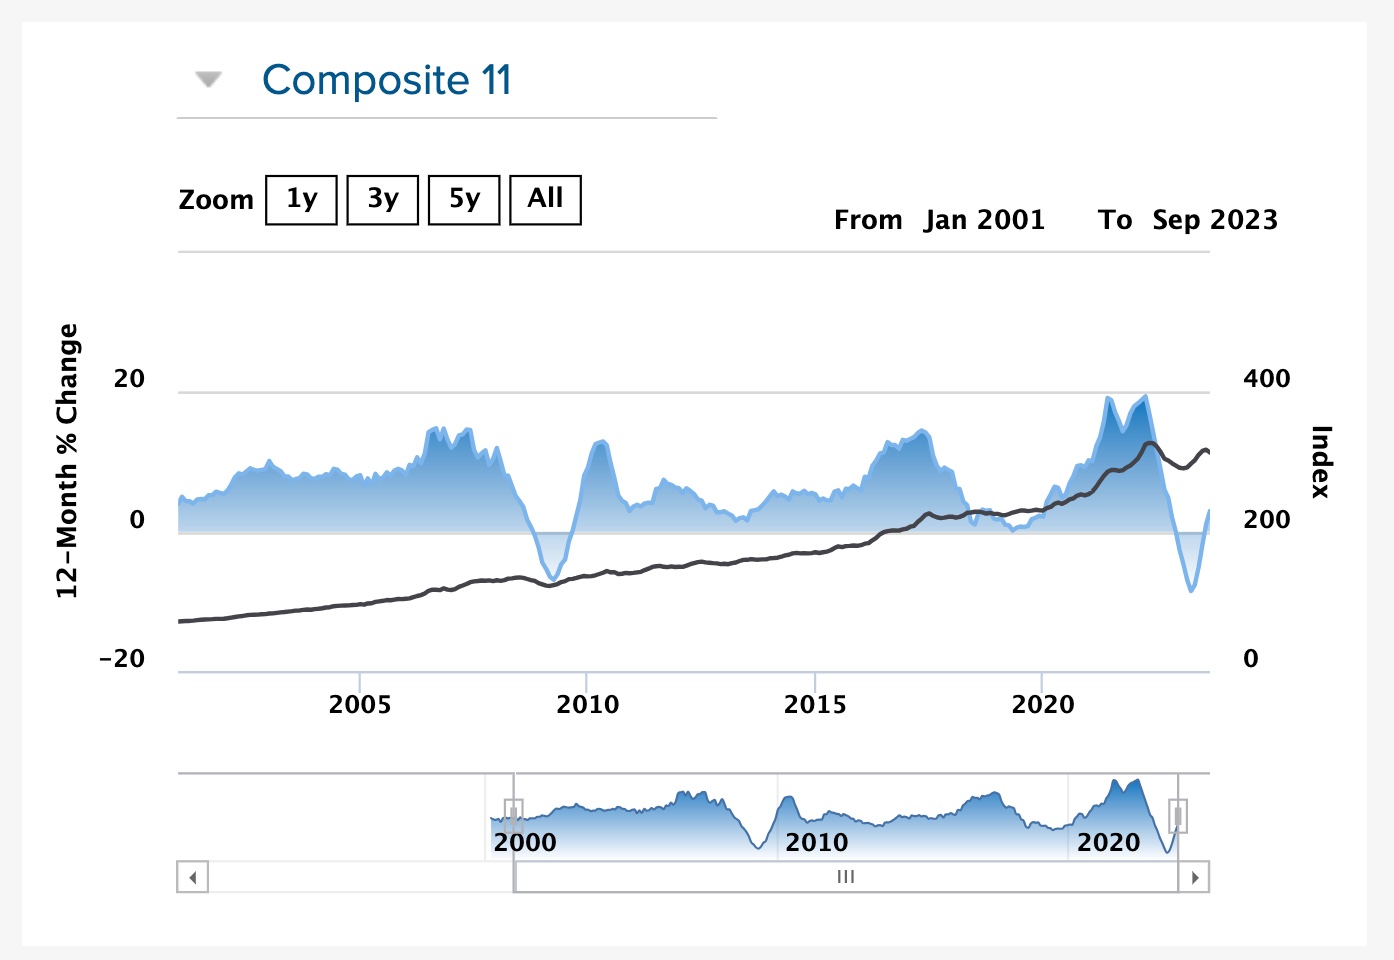
After adjusting for seasonal effects, the Teranet-National Bank Composite House Price IndexTM, which covers the country’s eleven largest CMAs, grew by 0.7% from August to September, the fifth consecutive monthly increase, but at a much slower pace than the previous month. In September, all 11 CMAs included in the index recorded increases, with the strongest growth in Halifax (+1.9%), Ottawa-Gatineau (+1.7%) and Victoria (+1.7%). Conversely, the smallest increases were in Montreal (+0.1%), Hamilton (+0.1%) and Edmonton (+0.2%). Growth was also observed in 12 of the 20 CMAs not included in the composite index for which data is available in September. The strongest monthly increases were seen in Sherbrooke (+5.2%), Lethbridge (+3.6% after a 4.0% decline the previous month) and Guelph (+2.5%). Conversely, the biggest decreases were in Sudbury (-5.8% after an increase of 7.3% the previous month), Saint John (-5.2% after an increase of 9.5% the previous month) and Moncton (-2.8% after an increase of 5.3% the previous month).
Before seasonal adjustments, however, the Teranet-National Bank Composite House Price IndexTM fell by 1.3% from August to September, the first decrease after six consecutive monthly increases.
YEAR-OVER-YEAR
The Teranet-National Bank Composite Home Price IndexTM rose by 3.0% from September 2022 to September 2023. Increases were observed in 6 of the 11 cities making up the composite index in September. Halifax and Calgary led the way with year-over-year price increases of 6.0%, followed by Vancouver with a 5.8% gain and Victoria with a 4.4% growth. As for the lagging markets, prices fell most sharply in Winnipeg (-1.2%), Hamilton (-1.0%) and Montreal (-0.8%). As for the other 20 CMAs not included in the composite index, annual gains were observed in 14 of them. The strongest growth was recorded in Saint John (+14.0%) and Sherbrooke (+11.1%), while the steepest declines were in Belleville (-2.7%) and Barrie (-2.7%).
Read the full report here
Knowing what homes have sold for in your area, and how active listings are priced, is very important information when the time comes to put your home on the market. This information will give you a good idea of what your home might sell for if you were to put it up for sale in today's market.
Find Out What The Home Down The Street Sold For!
FREE List Of Recent Home Sales And Active Listings In Your Area - Click Here