
Home Prices Rise for the First Time in Eleven Months

Before seasonal adjustments, the Teranet-National Bank™ Composite House Price Index, which covers the country’s eleven largest CMAs, rose by 1.6% from April to May, the third consecutive monthly increase.
After adjusting for seasonal effects, the Teranet-National Bank™ Composite House Price Index rose by 0.6% from April to May, the first monthly increase in eleven months. In May, 8 of the 11 CMAs included in the index posted increases: Toronto (+1.6%), Winnipeg (+1.5%), Victoria (+1.3%), Edmonton (+1.3%), Quebec City (+1.2%), Montreal (+1.0%), Hamilton (+0.5%) and Calgary (+0.1%). Conversely, prices fell during the month in Halifax (-2.6%), Vancouver (-1.2%) and Ottawa-Gatineau (-0.3%). For other CMAs not included in the composite index, growth was observed in 10 of the 20 CMAs for which data is available in May. The strongest monthly increases were seen in Sudbury (+4.9%), Guelph (+4.7%) and Kingston (+4.6% after a drop of 11.6% the previous month). Conversely, notable decreases were recorded in Brantford (-8.1%) and Sherbrooke (-4.5%).
YEAR-OVER-YEAR
The Teranet-National Bank™ Composite Home Price Index fell by 7.6% from May 2022 to May 2023, a smaller annual contraction than the record drop recorded the previous month. Increases were still observed in 3 of the 11 cities making up the composite index in May. Calgary led the way with an 8.3% year-on-year price increase, followed by Edmonton with a 4.9% gain and Quebec City with 3.1% growth. As for the lagging markets, prices fell most sharply in Hamilton (-16.8%), Toronto (-10.3%) and Ottawa-Gatineau (-9.5%). As for the other 20 CMAs not included in the composite index, annual gains were observed in 4 of them. The strongest growth was recorded in Saint John (+7.2%) and Trois-Rivières (+3.9%), while the steepest declines were in Brantford (-21.9%), Peterborough (-18.5%), Oshawa (-17.7%) and Abbotsford-Mission (-17.4%).
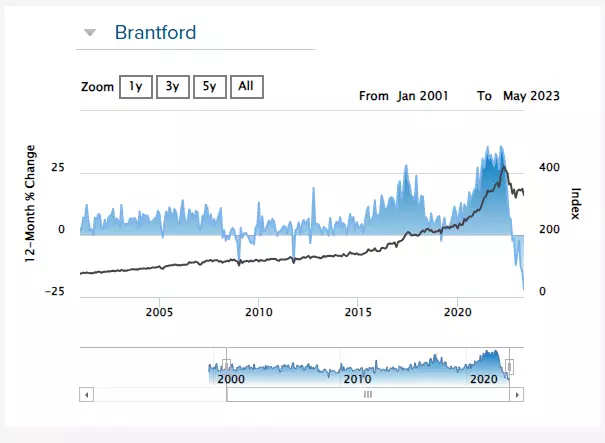
Brantford
Percent change month over month -5.91
% Change m/m Seasonally Adjusted -8.12
% Change Year over Year -21.89
From Peak -21.89
Peak Date May 2022
Read Original Article at HomePriceIndex.Ca